File Name: Value at Risk – Right Tail Capital Requirements
Location: Modeling Toolkit | Value at Risk | Right Tail Capital Requirements
Brief Description: Illustrates how to use Risk Simulator for running a risk-based correlated Monte Carlo simulation to obtain the right-tailed Value at Risk for Basel II/III requirements
Requirements: Modeling Toolkit, Risk Simulator
This model shows the capital requirements per Basel II/III requirements (99.95th percentile capital adequacy based on a specific holding period’s Value at Risk). Without running risk-based historical and Monte Carlo simulation using Risk Simulator, the required capital is $37.01M (Figure 159.1) as compared to only $14.00M required using a correlated simulation (Figure 159.2). This is due to the cross-correlations between assets and business lines, and can only be modeled using Risk Simulator. This lower VaR is preferred as banks can now be required to hold less required capital and can reinvest the remaining capital in various profitable ventures, thereby generating higher profits.
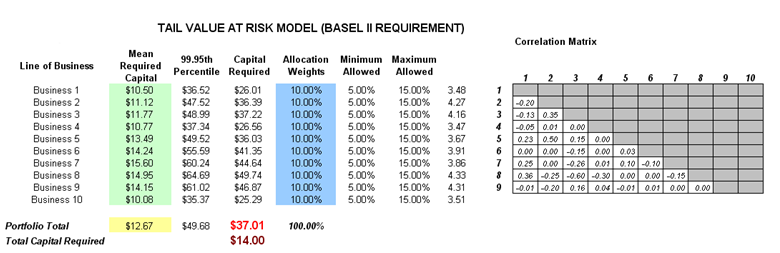
Figure 159.1: Right-tail VaR model
Procedure
- To run the model, click on Risk Simulator | Run Simulation (if you had other models open, make sure you first click on Risk Simulator | Change Profile, and select the Tail VaR profile before starting).
- When simulation is complete, select Left-Tail in the forecast chart and enter in 95 in the Certainty box and hit TAB on the keyboard to obtain the value of $14.00M Value at Risk for this correlated simulation.
- Note that the assumptions have been set for you in advance in the model in cells C6:C15. However, you may set it again by going to cell C6 and clicking on Risk Simulator | Set Input Assumption, selecting your distribution of choice or use the default Normal Distribution (as a quick example) or perform a distributional fitting on historical data and click OK. Continue this process for the remaining cells in column C. You may also decide to first Remove Parameters of these cells in column C and set your own distributions. Further, correlations can be set manually when assumptions are set (Figure 159.3) or by going to Risk Simulator | Edit Correlations (Figure 159.4) after all the assumptions are set.
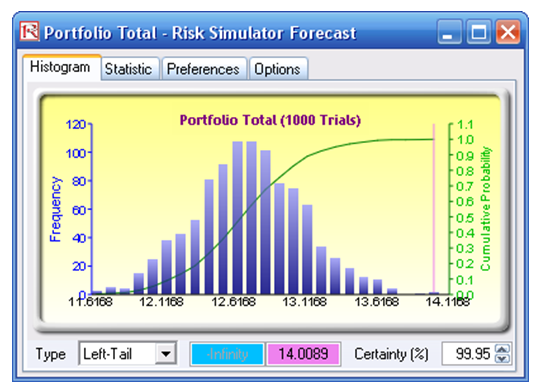
Figure 159.2: Simulated results of the portfolio VaR
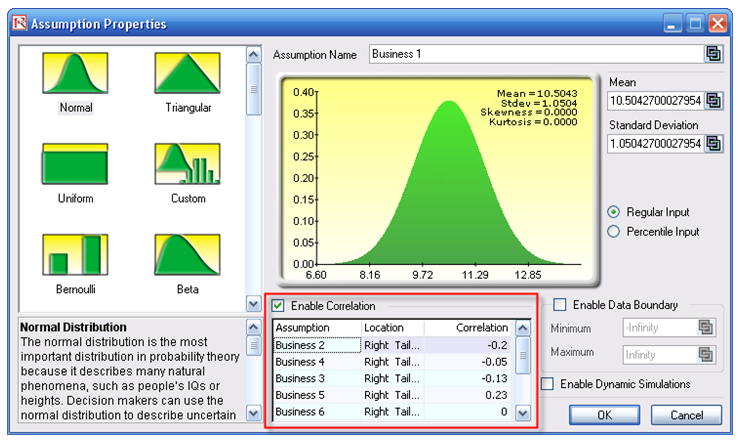
Figure 159.3: Setting correlations one at a time
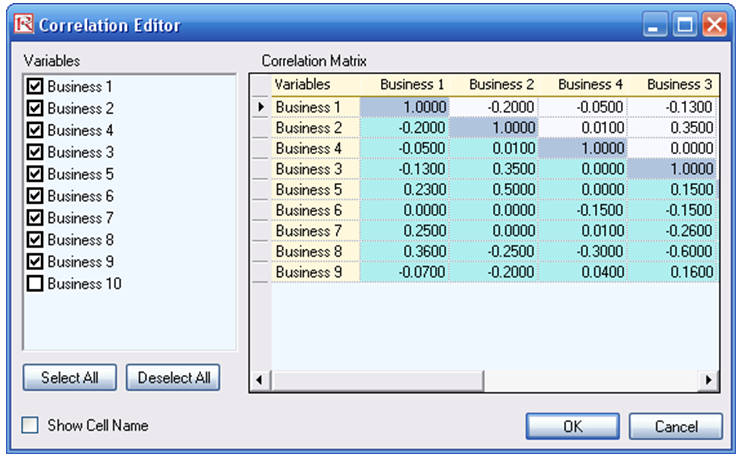
Figure 159.4: Setting correlations using the correlation matrix routine