File Name: Risk Hedging – Foreign Exchange Cash Flow Model
Location: Modeling Toolkit | Risk Hedging | Foreign Exchange Cash Flow Model
Brief Description: Illustrates how to use Risk Simulator for simulating the foreign exchange rate to determine whether a hedged fixed exchange rate or floating unhedged rate is worth more
Requirements: Modeling Toolkit, Risk Simulator
This cash flow model is used to illustrate the effects of hedging foreign exchange rates. The tornado sensitivity analysis illustrates that foreign exchange rate, or forex, has the highest effects on the profitability of the project. Suppose that the project undertaken is in a foreign country (FC), the values obtained are denominated in FC currency, and the parent company is in the United States and requires that the net revenues be repatriated back to the United States. The questions we ask here are: What is the appropriate forex rate to hedge at, and what are the appropriate costs for that particular rate? Banks will be able to provide your firm with the appropriate pricing structure for various exchange forward rates, but by using the model here, you can determine the added value of the hedge and hence decide if the value added exceeds the cost to obtain the hedge. This model is preset for you to run a simulation on.
The Forex Data worksheet shows historical exchange rates between the FC and U.S. dollar. Using these values, we can create a custom distribution (we simply used the rounded values in our illustration), which is preset in this example model.
However, should you wish to replicate the model setup, you can follow these steps:
- Start a new profile(Risk Simulator | New Profile) and give it an appropriate name.
- Go to the Forex Data worksheet and select the data in cells K6:K490 and click on Edit | Copy or Ctrl + C.
- Select an empty cell (e.g., cell K4) and click on Risk Simulator | Set Input Assumption, and select Custom Distribution.
- Click on Paste to paste the data into the custom distribution, then Update Chart to view the results on the chart. Then, click File | Save and save the newly created distribution to your hard drive.
- Go to the Model worksheet and select the Forex cell (J9). Click on Risk Simulator | Set Input Assumption, and choose Custom, then click on Open a distribution and select the previously saved custom distribution.
- You may continue to set assumptions across the entire model, and set the NPV cell as a forecast (Risk Simulator | Set Output Forecast).
- RUN the simulation with the custom distribution to denote an unhedged position. You can then rerun the simulation but this time, delete the custom distribution (use the Delete Simulation Parameter icon, not Excel’s delete function or the keyboard’s delete key) and enter in the relevant hedged exchange rate, indicating a fixed You may create a report after each simulation to compare the results. A smarter approach is to duplicate the simulation profile and delete this input assumption on the duplicated profile. You can then switch between profiles to run the hedged and unhedged positions.
From the sample analysis, we obtain the following information:
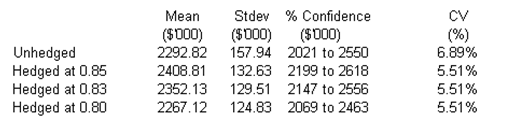
From this information, several things are evident:
- The higher the hedged exchange rate is, the more profitable the project (e.g., 0.85 USD/FC is worth more than 0.80 USD/FC).
- The relative risk ratio, computed as the coefficient of variation (CV, or the standard deviation divided by the mean) is the same regardless of the exchange rate, as long as it is hedged.
- The CV is lower for hedged positions than unhedged positions, indicating that the relative risk is reduced by hedging.
- It seems that the exchange rate hedge should be above 0.80, such that the hedged position is more profitable than the unhedged.
- In comparing a hedged versus an unhedged position, we can determine the amount of money the hedging is worth; for instance, going with a 0.85 USD/FC means that on average, the hedge is worth $115,990,000 (computed as $2,408.81 – $2,292.82 denominated in thousands). This means that as long as the cost of the hedge is less than this amount, it is a good idea to pursue the hedge. In fact, hedging at 0.83 USD/FC returns a lower expected value on the project, making this hedge level less optimal. Finally, the higher the hedge, the lower the risk to the project (as evident from the standard deviation), but again, a higher hedge costs more and the expected value of the project becomes lower. See Figures 127.1–127.4.
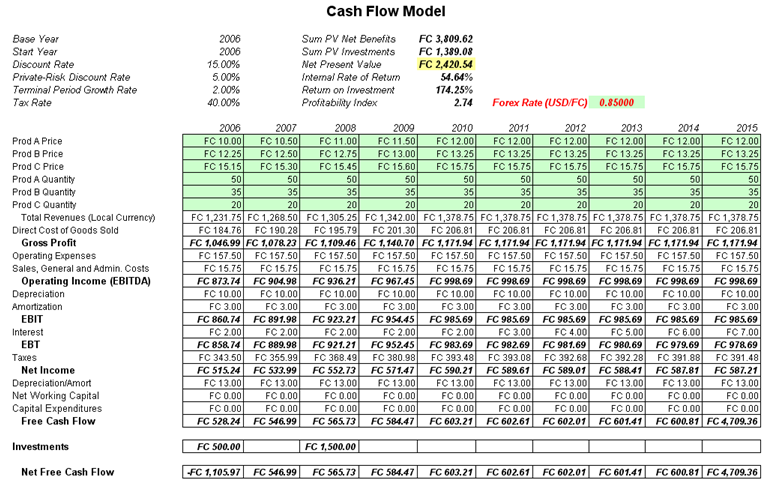
Figure 127.1: Hedging cash flow models
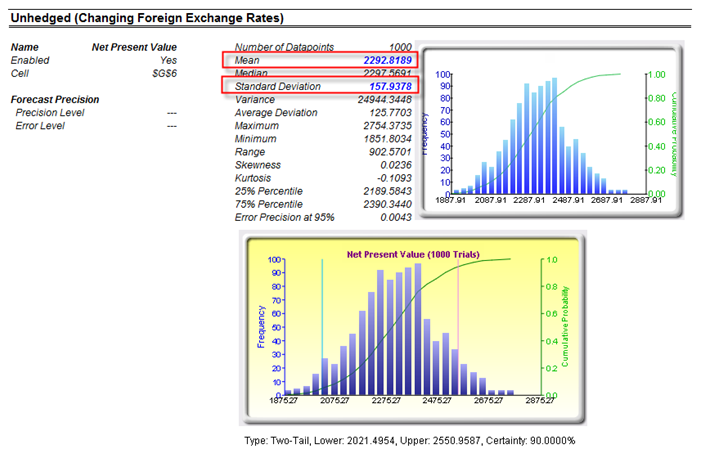
Figure 127.2: Unhedged cash flow models
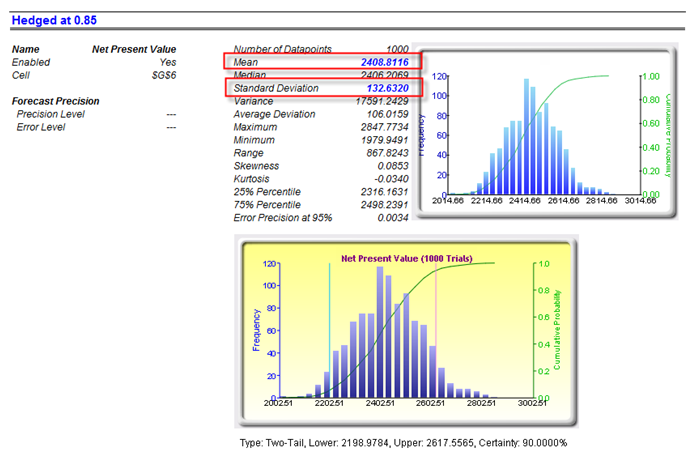
Figure 127.3: Hedged at 0.85 USD/FC
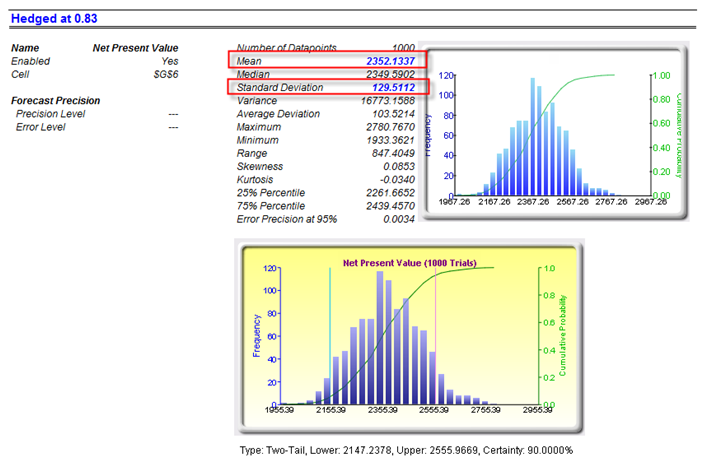
Figure 127.4: Hedged at 0.83 USD/FC