File Name: Forecasting – Nonlinear Extrapolation
Location: Modeling Toolkit | Forecasting | Nonlinear Extrapolation
Brief Description: Illustrates how to forecast with a nonlinear extrapolation as well as compare the results using more conventional time-series decomposition forecasts with trends and seasonality effects
Requirements: Modeling Toolkit, Risk Simulator
This model provides some historical data on sales revenues for a firm. The goal of this exercise is to use Risk Simulator to run the Nonlinear Extrapolation tool and forecast the revenues for the next several periods. The data are located in the Time-Series Data worksheet and are arranged by months, from January 2004 to December 2004. As the data are time series in nature, we can apply extrapolation to forecast the results.
Nonlinear Extrapolation
Note that the Nonlinear Extrapolation methodology involves making statistical projections by using historical trends that are projected for a specified period of time into the future. It is only used for time-series forecasts. Extrapolation is fairly reliable, relatively simple, and inexpensive. However, extrapolation, which assumes that recent and historical trends will continue, produces large forecast errors if discontinuities occur within the projected time period.
To run this model, simply:
- Go to the Time-Series Data worksheet.
- Select the Sales Revenue data series (cells H11:H22) and select Risk Simulator | Forecasting | Nonlinear Extrapolation (Figure 88.1).
- Extrapolate for 6 Periods using the Automatic Selection option.
- Repeat the process by selecting the Net Income data series (cells M11:M22).
- Select cells H11:H22 again but this time run a Time-Series Analysis with a forecast period of 6 with the seasonality of 6 (Risk Simulator | Forecasting | Time Series Analysis).
- Repeat Step 5’s Time-Series Analysis on cells M11:M22.
- Compare the results from Extrapolation and Time-Series Analysis.
Model Results Analysis
For your convenience, the analysis Report worksheets are included in the model. A fitted chart and forecast values are provided as well as the error measures and a statistical summary of the methodology. Notice that when the historical data and future expectations are such that growth rates are nonlinear and smooth, extrapolation works better. Similar to the case of the sales revenues, compare the graphs visually and see the corresponding RMSE or root mean squared error values, where the smaller this error, the better the model fits and forecasts the data, but when seasonality occurs, time-series analysis is better.
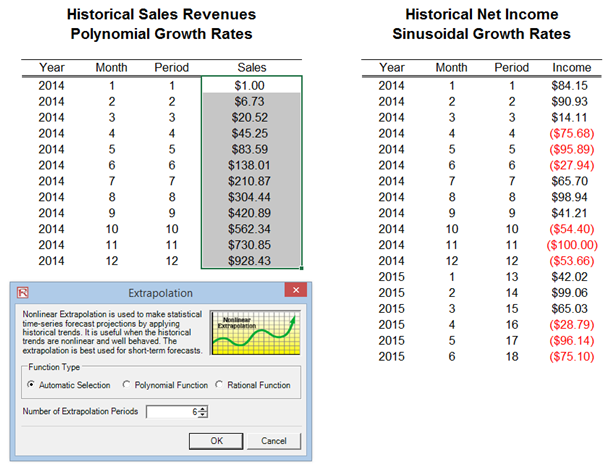
Figure 88.1: Nonlinear extrapolation