File Name: Simulation – Data Fitting
Location: Modeling Toolkit | Risk Simulator | Data Fitting
Brief Description: Illustrates how to use Risk Simulator for fitting a single variable to existing data, fitting multiple variables to existing data, and simulating, extracting data, and refitting to distributions
Requirements: Modeling Toolkit, Risk Simulator
This example illustrates how existing sample data can be used to find the statistically best-fitting distribution. By doing so, we also confirm the simulation results through the distributional fitting routine; that is, we simulate a particular distribution, extract its raw data, and refit the simulated data back to all distributions.
Running a Single-Fit
To run this model, simply:
- Go to the Raw Data worksheet in the model and select cells C2:C201.
- Click on Risk Simulator | Analytical Tools | Distributional Fitting (Single Variable).
- Make sure Fit Continuous Distributions is selected and all distributions are checked, then click OK (Figure 137.1).
- The resulting fit of all distributions is shown. Select the best fit (ranked first), view the statistics, and click OK (Figure 137.2).
- A report will be generated indicating all the relevant statistics as well as the data used for fitting (for future reference).
Note that if a profile exists and if the Automatically Generate Assumption choice is selected (Figure 137.2), the report will contain an assumption that is the best fit. Otherwise, only the type of distribution and its relevant input assumptions are provided. You can repeat this exercise on the remaining data points provided.
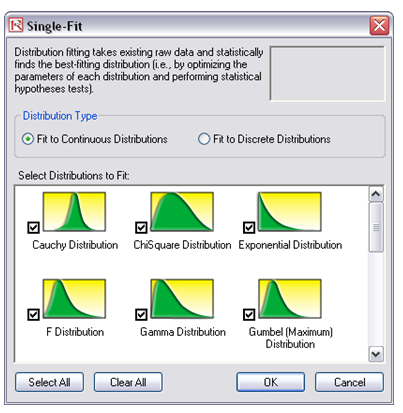
Figure 137.1: Fitting to multiple distributions
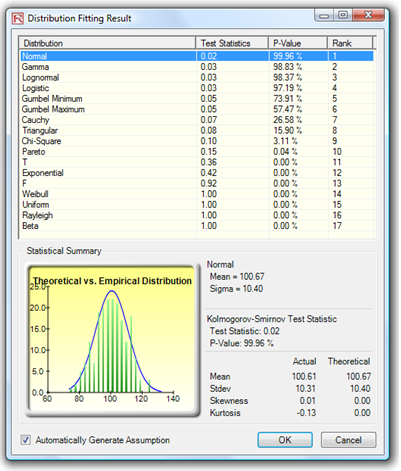
Figure 137.2: Distributional fitting results
Notes
You can replicate the fitting routine on multiple variables simultaneously (variables must be arranged in contiguous columns) instead of one at a time. Select the area C2:E201 and run the multiple variable fitting routine by selecting Risk Simulator | Analytical Tools | Distributional Fitting (Multi-Variable).
However, there are several key points to remember. First, more data implies a better statistical fit. Do not fit to very few data points and expect a good fit. Second, only positive discrete data (integers) can be fitted to discrete distributions. When negative values or continuous data exist, you should always fit to continuous distributions (or first transpose them to the positive region). Third, certain distributions are related to other distributions through their statistical properties. For example, a t-distribution becomes a normal distribution when degrees of freedom is high; a Poisson distribution can be used to approximate a binomial; or a normal can be used to approximate a Poisson, hypergeometric, and binomial. In addition, the beta and gamma distributions are highly flexible. For instance, in the beta distribution, if the two inputs parameters, alpha and beta, are equal, then the distribution is symmetrical. If either parameter is 1 while the other parameter is greater than 1, the distribution is triangular or J-shaped. If alpha is less than beta, the distribution is said to be positively skewed (most of the values are near the minimum value). If alpha is greater than beta, the distribution is negatively skewed (most of the values are near the maximum value). There are many other such relationships. Just because the fit is not exactly to the distribution expected does not mean the data are bad or the routine is incorrect. It simply means that another distribution is better suited for the data.
When performing a Multiple Variable Fitting, make sure to select the right distribution type for the variables (e.g., continuous for the first two and discrete for the third distribution in our model). Further, do not select the variable name when fitting; instead, enter the variable name in the fitting dialog box. Also, if you have an existing simulation profile (Risk Simulator | New Simulation Profile), you can select the Automatically Generate Assumptions option such that the report will have assumptions set up for you.
Further, these assumptions will also include correlations. Then the question is what correlation coefficient is significant for this dataset (i.e., is a correlation of 0.0151 significant or merely a residual effect of randomness and should not be incorporated? What about 0.016 or 0.15, etc.?). Risk Simulator automatically computes the statistical significance cutoff level (in this case, any correlations above the absolute value of 0.0910 are statistically significant). If you select this option, the software will ignore all correlations below this significance level. See Figure 137.3.
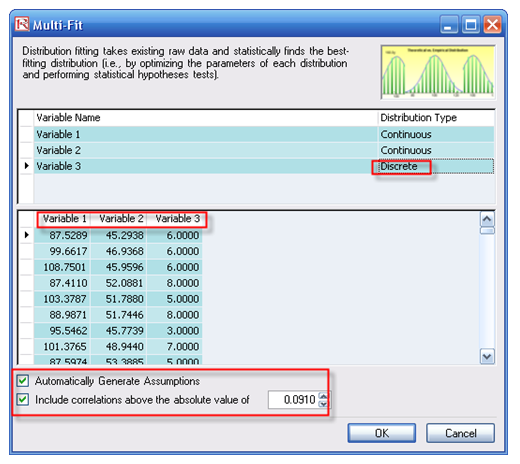
Figure 137.3: Multiple variables simultaneous fitting