- Related AI/ML Methods: Custom Fit Model, Ensemble Complex Fit
- Related Traditional Methods: ARIMA, Time-Series Forecasting
Commonly used to refer to a network or circuit of biological neurons, modern usage of the term neural network often refers to artificial neural networks that consist of artificial neurons, or nodes, recreated in a software environment. Such networks attempt to mimic the neurons in the human brain in ways of thinking and identifying patterns and, in our situation, identifying patterns for the purposes of forecasting time-series data.
Note that the number of hidden layers in the network is an input parameter and will need to be calibrated with your data. Typically, the more complicated the data pattern, the higher the number of hidden layers you would need and the longer it would take to compute. It is recommended that you start at 3 layers. The testing period is simply the number of data points used in the final calibration of the Neural Network model, and we recommend using at least the same number of periods you wish to forecast as the testing period.
- Linear. Applies a linear function, where
 .
. - Nonlinear Logistic. Applies a non linear logistic function, where
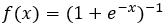 .
. - Nonlinear Cosine with Hyperbolic Tangent. Applies a non linear cosine with hyperbolic tangent function, where
 .
. - Nonlinear Hyperbolic Tangent. Applies a nonlinear hyperbolic tangent function, where
 .
.
The neural mapping (Figure 9.74) assumes that ![]() is the dependent variable, whereas
is the dependent variable, whereas ![]() and constant terms are the independent variables. The neural network has an input layer, a hidden layer, and an output layer. There are 3 inputs in the input layer, a neuron for the biases, 4 neurons in the hidden layer, and 1 neuron in the output layer.
and constant terms are the independent variables. The neural network has an input layer, a hidden layer, and an output layer. There are 3 inputs in the input layer, a neuron for the biases, 4 neurons in the hidden layer, and 1 neuron in the output layer.
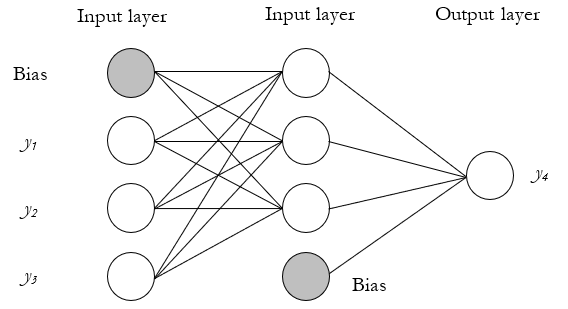
Figure 9.74: Multiple-layered Perceptron Neural Network
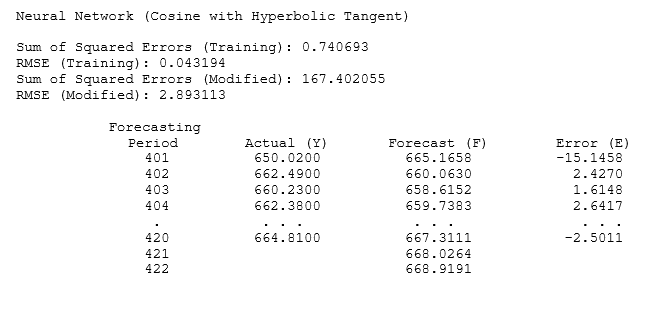
Figure 9.75 illustrates the neural network algorithms in BizStats. The historical time-series data is entered as the first variable, VAR227. Then, 3 perceptron layers are requested, and 20 data points are used as the testing set. The dataset has 420 data points and entering 20 indicates that we use the first 400 of these data to perform training and calibration on the model, leaving the last 20 data points for testing the model. On completion of the testing, the model is then used to forecast the next future 2 data points. The number of forecast periods has to be ≥1. Finally, the model is run through internal multiphasic optimization routines. Setting this to 1 (for “yes”) makes it slightly longer to run but provides a more accurate calibration of the results. A chart is also provided (Figure 9.76) in the results to visually examine how good the forecast fit is.
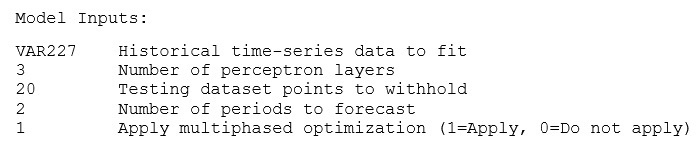
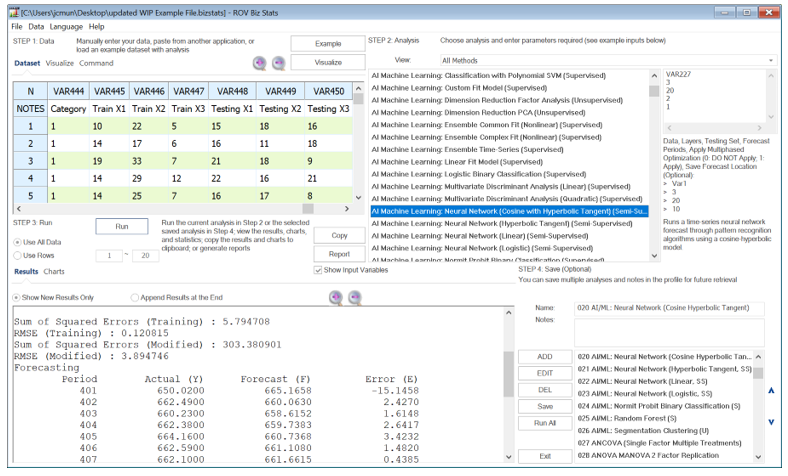
Figure 9.75: AI/ML Neural Network (Supervised)
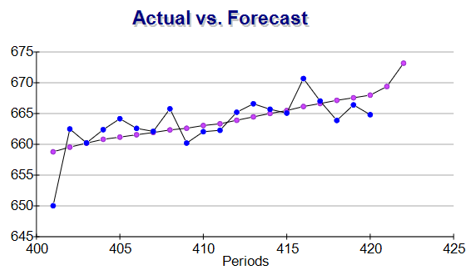
Figure 9.76: AI/ML Neural Network (Supervised)