Figure 5.4 is a replica of Figure 5.1’s complex path using PEAT’s project management module. The same input assumptions are entered in Figure 5.5. We see the single-point estimate’s completion time of 276 days is the same as that calculated manually in Figure 5.2.
Notice that in Figure 5.2, the critical tasks were Tasks 15, 16, 17, 18, 20, and 21. In Figure 5.4, these same tasks are on the highlighted critical path. However, notice that by convention, a critical path is, by definition, a pathway, from the start of the project to the end of the project. Hence, Figure 5.4 shows the critical path from Task 1, 13, and 14 connecting to the critical tasks 15, 16, 17, 18, 20, and 21.
Figure 5.6 shows the development of a GANTT chart. GANTT charts are sometimes used in project management as a way of showing the tasks in rows displayed against time on the x-axis. On the left of the chart is a list of the tasks in rows and along the top is the time scale or dates.
The completed column is the earliest finish time of the preceding task multiplied by the percentage of completion (e.g., 4.5 is computed by 15 × 30%) and the remaining is its complement value 10.5 or 15 × (1–30%). Finally, the start date column is the preceding task’s date plus the simulated duration in Figure 5.2.
The GANTT chart is then generated based on these values that are shown as a horizontal bar chart with completed and remaining segments for each task.
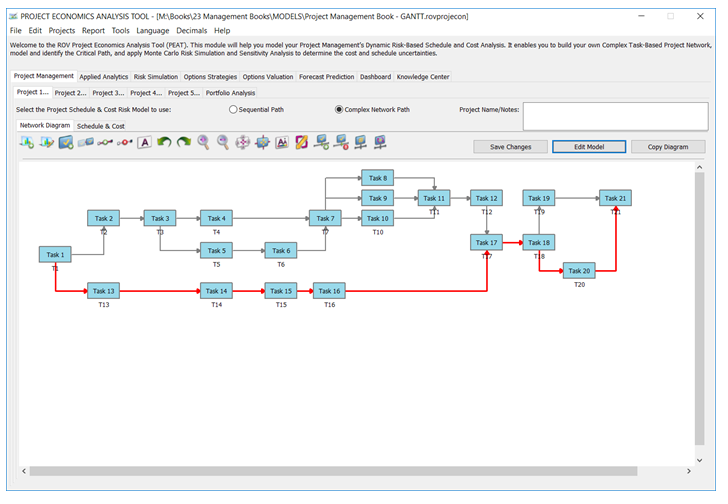
Figure 5.4: Complex Path in PEAT
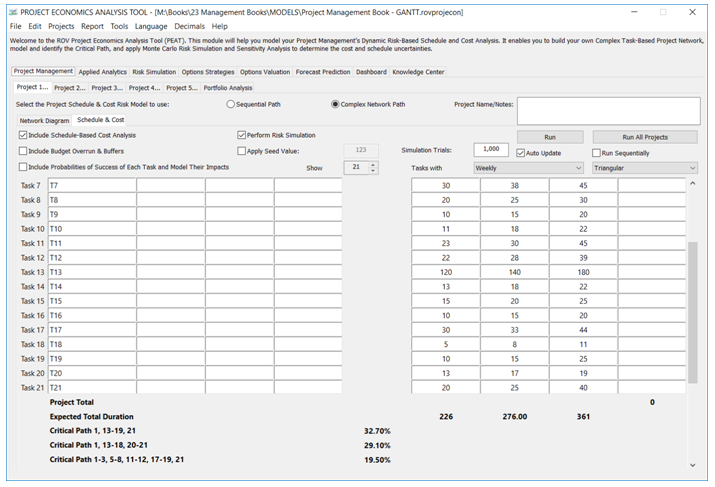
Figure 5.5: Simulated Complex Path in PEAT
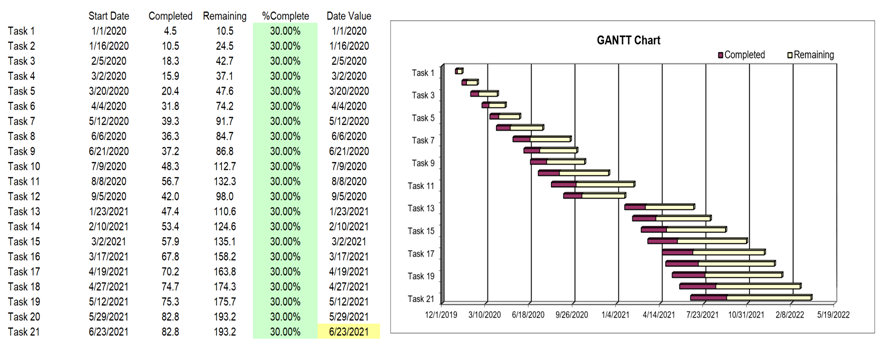
Figure 5.6: GANTT Chart