File Name: Debt Analysis – Debt Repayment and Amortization
Location: Modeling Toolkit | Debt Analysis | Debt Repayment and Amortization
Brief Description: Simulates interest rates on a mortgage and amortization schedule to determine the potential savings on interest payments if additional payments are made each period and when the interest rates can become variable and unknown over time
Requirements: Modeling Toolkit, Risk Simulator
This is an amortization model examining a debt repayment schedule. In this example, we look at a 30-year mortgage with a portion of that period based on a fixed interest rate, and a subsequent period of variable rates with minimum and maximum caps. This model illustrates how the mortgage or debt is amortized and paid off over time, resulting in a final value of zero at the end of the debt’s maturity (Figure 18.1). Further, this model allows for some additional periodic (monthly, quarterly, semiannually, annually) payments, which will reduce the total amount of payments, the total interest paid, and the length of time it takes to pay off the loan. Notice that initially the principal paid off is low but increases over time. Because of this, the initial interest portion of the loan is high but decreases over time as the principal is paid off.
The required input parameters are highlighted in boxes, and an assumption on the uncertain interest rate is set in cell D9, with a corresponding forecast cell at I12. By entering additional payments per period, you can significantly reduce the term of the mortgage (i.e., pay it off faster), and at a much lower total payment (you end up saving a lot on interest payments). A second forecast cell is set on J12 to find out the number of years it takes to pay off the loan if additional periodic payments are made.
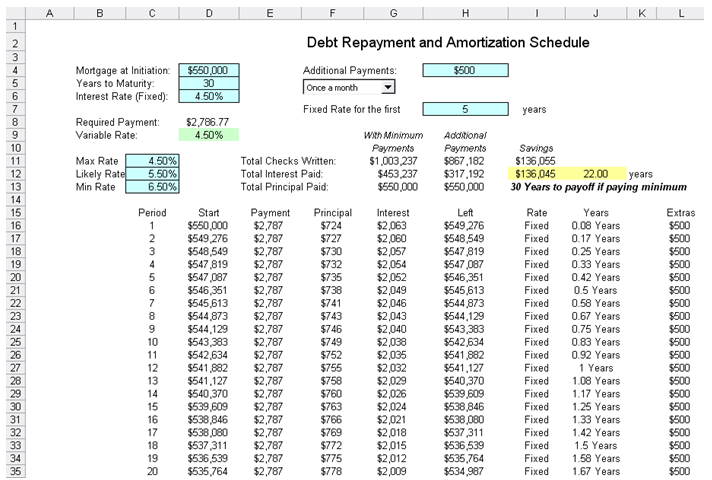
Figure 18.1: Debt amortization table
Procedure
You may either change the assumptions or keep the existing assumptions and run the simulation:
- Click on Risk Simulator | Change Profile and select the Debt Repayment and Amortization profile and click OK.
- Run the simulation by clicking on Risk Simulator | Run Simulation.
Interpretation
The resulting forecast chart on the example inputs indicates that paying an additional $500 per month can potentially save the mortgage holder $136,985 (minimum) and at most $200,406 (maximum), given the assumed uncertainty fluctuations of interest rates during the variable rate period. The 90% confidence level also can be obtained, meaning that 90% of the time, the total interest saved is between $145,749 and $191,192 (Figures 18.2 and 18.3).
In addition, the Payoff Year with Extra Payment forecast chart shows that given the expected fluctuations of interest rates and the additional payments made per period, there is a 90% chance that the mortgage will be paid off between 20.9 and 21.8 years, with an average of 21.37 years (mean value). The quickest payoff is 20.67 years (minimum). If interest rates are on the high end, the payoff may take up to 22 years (maximum), as seen in Figures 18.4 and 18.5.
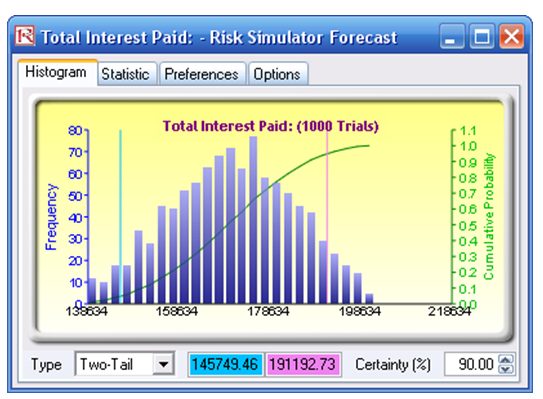
Figure 18.2: Forecast of total interest paid
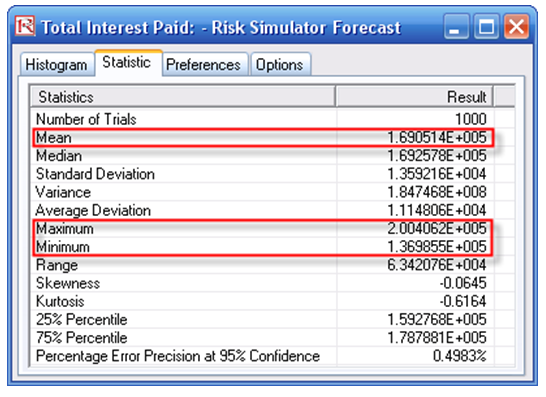
Figure 18.3: Forecast statistics of total interest paid
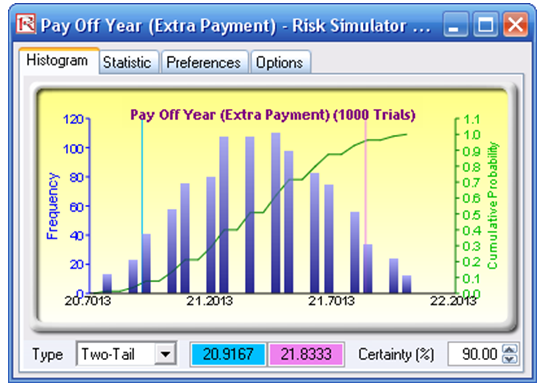
Figure 18.4: Forecast of payoff year
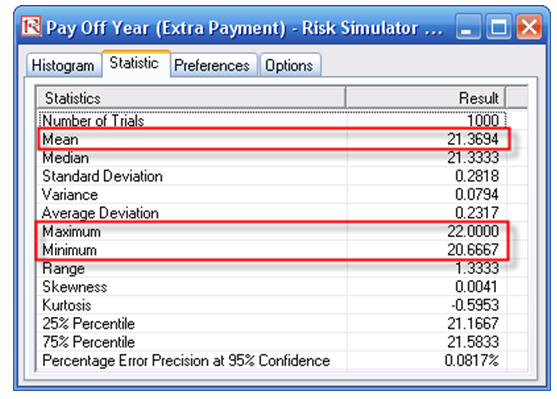
Figure 18.5: Forecast statistics of payoff year