File Name: Operational – Queuing Models at Bank Branches
Location: Modeling Toolkit | Operational | Queuing Models at Bank Branches
Brief Description: Illustrates how to set up a queuing model, run a Monte Carlo simulation on a queuing model, and interpret the results of a queuing model
Requirements: Modeling Toolkit, Risk Simulator
Modeling Toolkit Functions Used: MTQueuingSCProbNoCustomer, MTQueuingSCAveCustomersWaiting, MTQueuingSCAveCustomersinSystem, MTQueuingSCAveTimeWaiting, MTQueuingSCAveTimeinSystem, MTQueuingSCProbHaveToWait, MTQueuingSCAProbNoCustomer, MTQueuingSCAAveCustomersWaiting, MTQueuingSCAAveCustomersinSystem, MTQueuingSCAAveTimeWaiting, MTQueuingSCAAveTimeinSystem, MTQueuingSCAProbHaveToWait, MTQueuingMCProbNoCustomer, MTQueuingMCAveCustomersWaiting, MTQueuingMCAveCustomersinSystem, MTQueuingMCAveTimeWaiting, MTQueuingMCAveTimeinSystem, MTQueuingMCProbHaveToWait, MTQueuingMGKProbBusy, MTQueuingMGKAveCustomersinSystem
Model Background
Think of how queuing models work; consider a customer service call center, a bank teller’s waiting line, or the waiting line at an ATM machine. The queue is the line of people waiting to get served. Typically, the arrival rates of patrons follow a Poisson distribution on a per-period basis, per hour or per day, and so on. The number of checkout counters open is the number of channels in a queuing model. The rate at which servers are able to serve patrons typically follows an exponential distribution. The questions that a queuing model answers are how many servers or channels there should be if we do not want patrons to wait more than X minutes, or, if we have Y servers, what the probability is that a patron arriving will have to wait and what the average wait time is. These types of models are extremely powerful when coupled with simulation, where the arrival rates and service times are variable and simulated. Imagine applications from staffing call centers, customer service lines, and checkout counters to how many hospital beds should exist in a hospital per type of diagnostic-related group and the like.
These models are based on operations research queuing models. The single-channel queuing model and the multiple-channel queuing model assume a Poisson distribution of arrival rates and an exponential distribution of service times, with the only difference between them being the number of channels. Both the MG1 Single Arbitrary model and MGK Blocked Queuing model assume the same Poisson distribution on arrival rates but do not rely on the exponential distribution for service times. The two main differences between these two general-distribution (G) models are that the MGK uses multiple channels as compared to the single-channel MG1, as well as the fact that the MG1 model assumes the possibility of waiting in line while the MGK model assumes customers will be turned away if the channels are loaded when they arrive.
Running a Monte Carlo Simulation
In all of these models, the results are closed form. Hence, only the input assumptions (arrival rates and service rates) are uncertain and should be simulated. The forecast results should be any of the outputs of interest. See Figures 93.1 and 93.2.
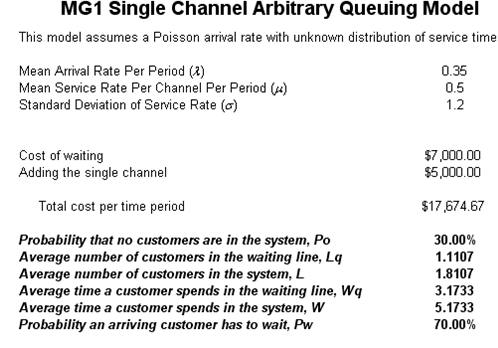
Figure 93.1: Single channel queuing model
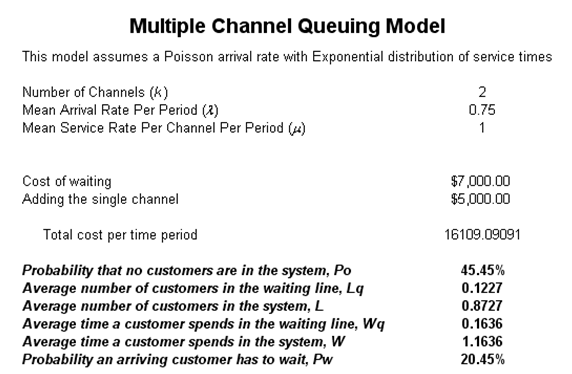
Figure 93.2: Multiple channel queuing model