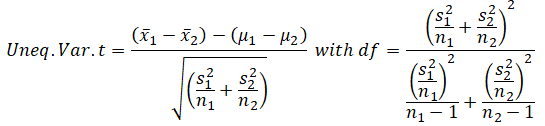
If the standard deviations of the two sample datasets are still unknown but assumed to be different, combining them into a single pooled estimate as done previously would be inappropriate. Therefore, the sample standard deviations (s) will be used independently to estimate the population standard deviations (σ). Nonetheless, normality of the underlying dataset is assumed, although this assumption becomes less important with larger datasets. The two-sample unequal variance t-test would be needed, and its specifications are:
As an example, suppose that a chemical manufacturer is testing a new engine oil additive to see if there is a significant difference in fuel efficiency. The manufacturer randomly selects 70 cars in a city and tests its additive on half of these cars selected randomly, leaving the other half without the additive. Figure 9.5 shows the mean and standard deviation of the two sample datasets. The hypotheses tested are the typical two-tail test:
H0: μ1 = μ2 that is, the two samples’ means are statistically similar
Ha: μ1 ≠ μ2 that is, the two samples’ means are statistically significantly different
The calculations are shown in Figures 9.5 and 9.6. The two-tail p-value is 0.0212, which is less than the standard alpha significance levels (α = 0.10, 0.05), so we can conclude that the engine oil additive has statistically significantly different miles per gallon fuel efficiency. Because the types of cars were not stratified and preselected, we do not know if the variances of the two sample datasets are identical. The unequal variance t-test is used in this case.
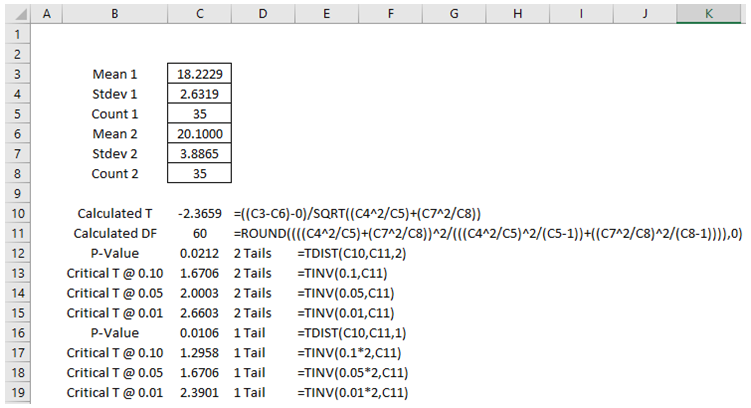
Figure 9.5: Example Calculations for Unequal Variance T-Test
Please note that in this example, we test H0: μ1 = μ2 which means that in the equation, we set μ1 – μ2= 0. This also means we need to set the hypothesized mean to 0 in BizStats (Figure 9.6).
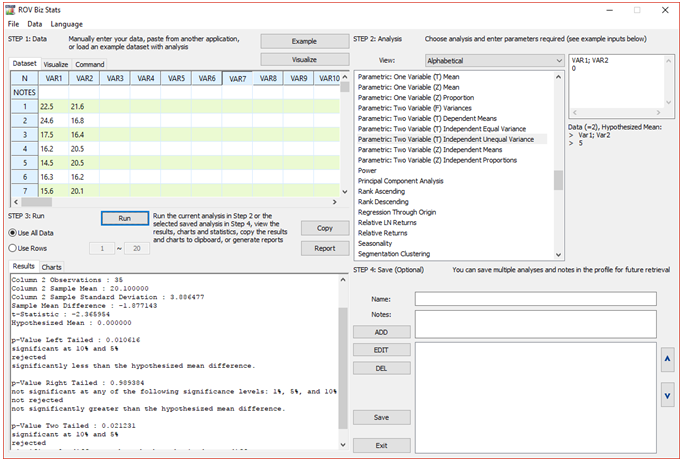
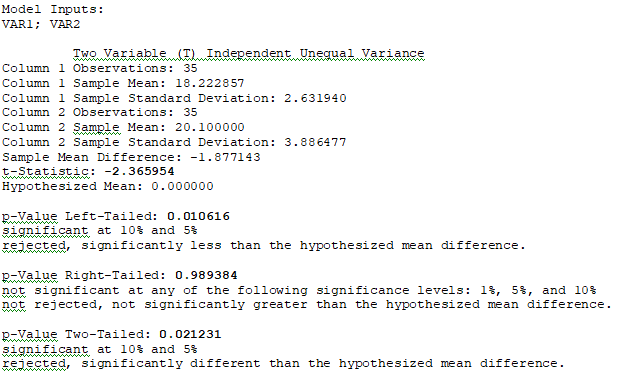
Figure 9.6: Unequal Variance T-Test in ROV BizStats