File Name: Project Management – Project Timing
Location: Modeling Toolkit | Project Management | Project Timing
Brief Description: Illustrates how to use Risk Simulator for simulating a project’s completion date and how to revert the simulated results back to dates
Requirements: Modeling Toolkit, Risk Simulator
This project management model (Figure 119.1) is used to illustrate how the completion dates of a project can be simulated and the resulting values converted back into a regular date format. The model assumes that the tasks are all sequential. For nonsequential and path-independent projects, see the Project Management – Critical Path Analysis (CPM PERT GANTT) model instead.
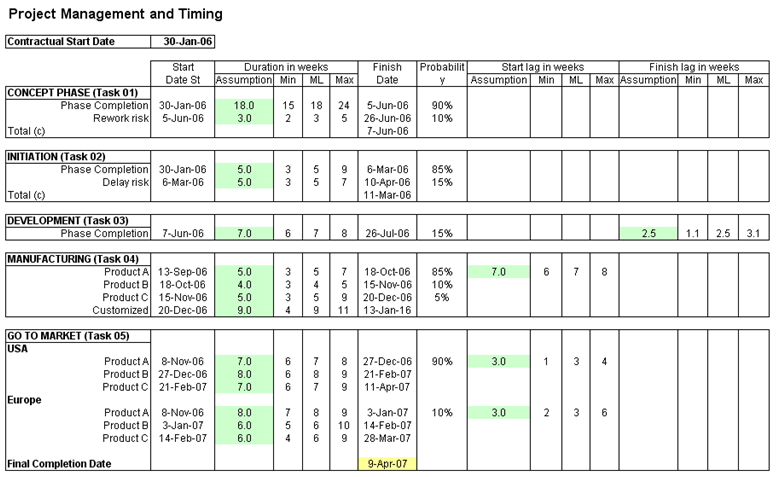
Figure 119.1: Project timing model
The input assumptions used for simulation are listed under the Assumption column, which are all set as triangular distributions (a typical distribution used in project management and related to the PERT distribution). These assumptions are then linked to the minimum (Min), most likely (ML), and maximum (Max) values of completion in weeks for each task and subtask. The final completion date is set as the output forecast. Because dates, when simulated, are presented in numerical values, using the forecast chart, you can determine the 90% certainty that the project will be completed by a certain time period, and so forth. In the example, the 90% Left-Tail confidence interval shows a value of 39210.046 as seen in Figure 119.2. Entering this value in any cell in Excel and then changing the properties of the cell to show dates rather than a numerical value (right-click on the cell, and select Format Cells | Date, and select the date format of your choice) will reveal that the 90th percentile date of completion is May 8, 2007.
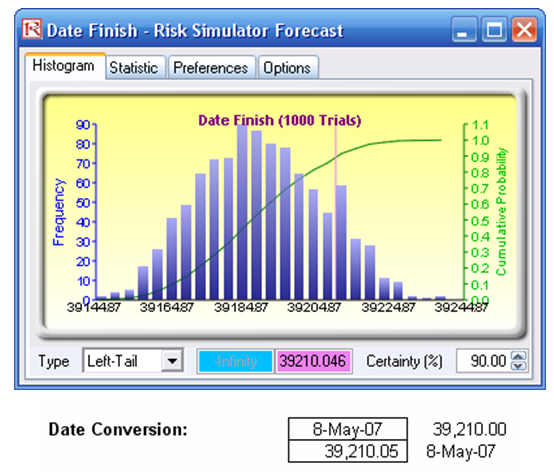
Figure 119.2: Probabilistic project completion dates