Tornado analysis and Scenario analysis are both static calculations. Dynamic Sensitivity (Figure 5.7 shows the DCF module’s default example’s Dynamic Sensitivity results after running the Simulate All Options at Once), in contrast, is a dynamic analysis, which can only be performed after a simulation is run. While tornado analysis applies static perturbations before a simulation run, sensitivity analysis applies dynamic perturbations created after the simulation run. Tornado and spider charts are the results of static perturbations, meaning that each precedent or assumption variable is perturbed a preset amount one at a time, and the fluctuations in the results are tabulated. In contrast, sensitivity charts are the results of dynamic perturbations in the sense that multiple assumptions are perturbed simultaneously and their interactions in the model and correlations among variables are captured in the fluctuations of the results. Tornado charts therefore identify which variables drive the results the most and hence are suitable for simulation, whereas sensitivity charts identify the impact on the results when multiple interacting variables are simulated together in the model. A tornado chart’s presimulation critical success factors will therefore sometimes be different from a sensitivity chart’s post-simulation critical success factor. The post-simulation critical success factors should be the ones that are of interest as these more readily capture the model precedents’ interactions.
Red bars on the Rank Correlation chart indicate negative correlations and green bars indicate positive correlations for the left chart. The correlations’ absolute values are used to rank the variables with the highest relationship to the lowest, for all simulation input assumptions. Contribution to Variance indicates the percentage fluctuation in the output variable that can be statistically explained by the fluctuations in each of the input variables.
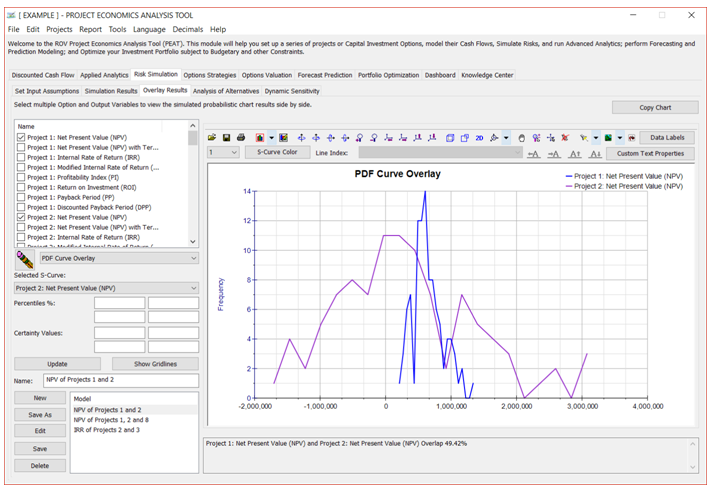
Figure 5.5 – Risk Simulation: Overlay Results
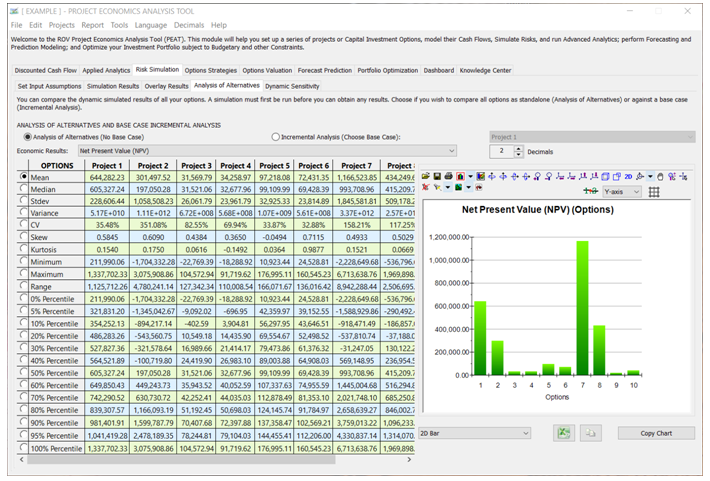
Figure 5.6 – Risk Simulation: Analysis of Alternatives
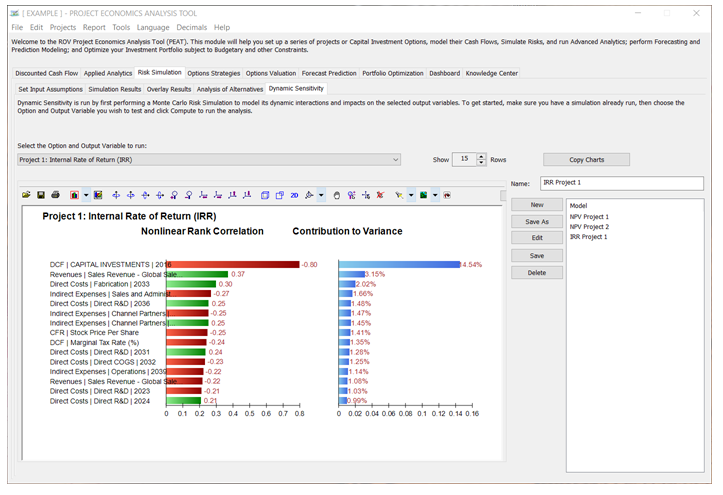
Figure 5.7 – Risk Simulation: Dynamic Sensitivity