This chapter showcases a complex task model and its manual computations to determine schedule and cost risk. The model illustrated in Figure 3.1 is a complex schedule network model for the project shown to the right with 24 tasks (nodes). The network is represented in the Activity-On-Node design. The nodes in the network correspond to each project task shown in the figure. The arrows in the figure indicate the precedence relationships between the tasks. A schedule model can be developed by assigning an input assumption for each task, representing the likelihood of completing the particular task at a specific duration. Typically, a triangular distribution is assigned to each activity using three parameters: 1) the minimum time to complete an activity, 2) the most likely time to complete an activity, and 3) the expected maximum time to complete an activity. One must next determine the beginning of the network, the end of the network and any merge points. Merge points are where different paths come together. In the illustration, Task 12 and Task 18 are merge points. The beginning and end can be considered pseudo-merge points. You will then create formulas to calculate the durations of the various paths from merge point to merge point and retain the longest (maximum) duration path as the subtotal duration for that part of the network.
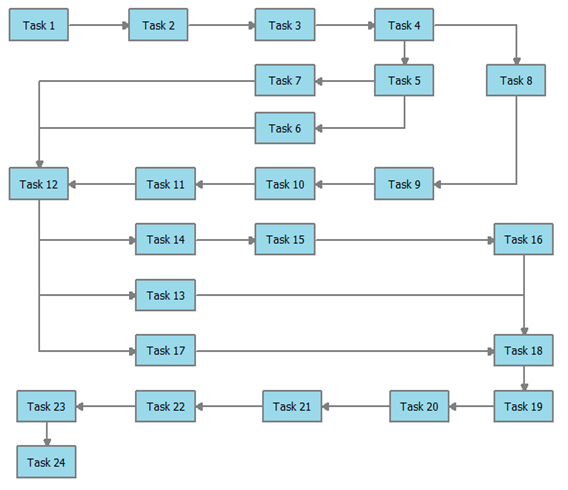
Figure 3.1: Sample Complex Task Model