File Name: Optimization – Optimization of a Harvest Model
Location: Modeling Toolkit | Optimization | Optimization of a Harvest Model
Brief Description: Illustrates how to find the optimal harvest rate for a population that maximizes return
Requirements: Modeling Toolkit, Risk Simulator
This is a population dynamics and harvest model, where, given an initial population and the growth rate of the population, we can determine the optimal harvest rate that maximizes the return on investment, given a specific cost of capital and carrying capacity of the population. For instance, this can be a model on a herd of cattle or a forest of trees, where there is a carrying or maximum capacity of the population. The population dynamics can be summarized as:
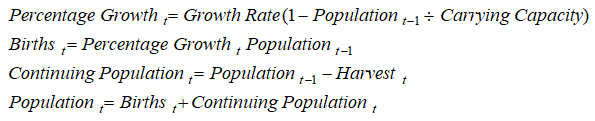
A sample set of inputs is provided, as are the model computations, and the time-series chart shows the population dynamics and interactions. Typically, if there is no excess harvesting, the continuing graph should stabilize over time as shown in Figures 102.1 and 102.2.
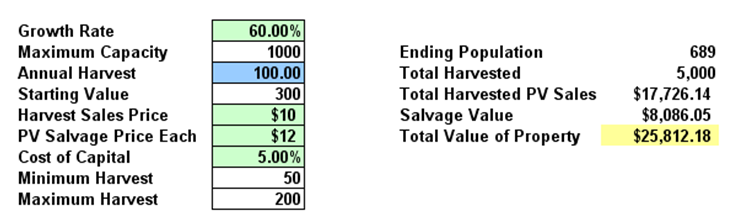
Figure 102.1: Harvest model
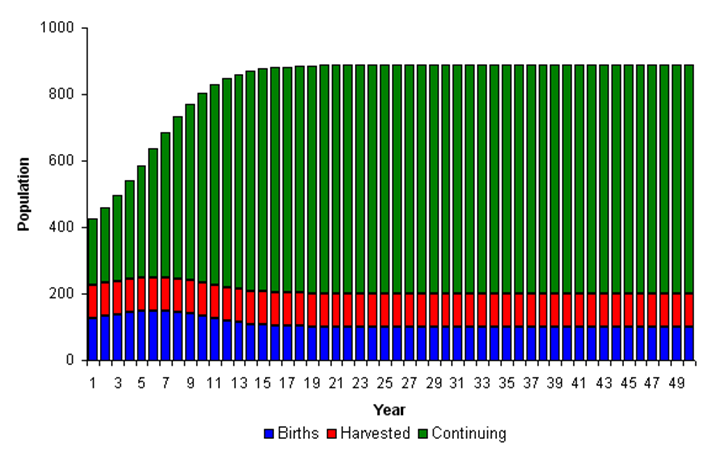
Figure 102.2: Harvest model chart
Procedure
The model has been preset with optimization parameters and simulation assumptions. To run this model, simply:
- Go to the Model worksheet and click on Risk Simulator | Change Profile and select the Population and Harvest Model profile.
- Click on the Run Optimization icon or Risk Simulator | Optimization | Run Optimization and click Replace when the optimization routine is complete.
You will see the optimal annual harvest is 125.80 thousand, providing the highest total value of the property (Figure 102.3). In fact, after the optimization is run, run a simulation on the optimized annual harvest. You can then see that there is a 53% certainty that this optimized harvest level will result in values greater than those expected without optimization (Figure 102.4).
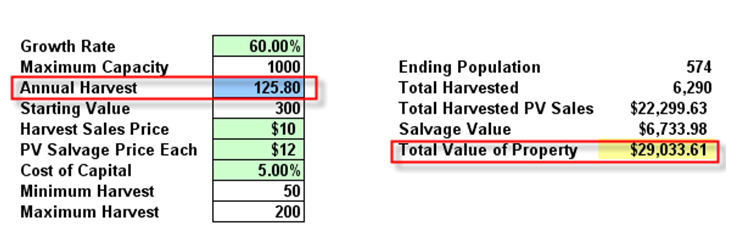
Figure 102.3: Optimized results
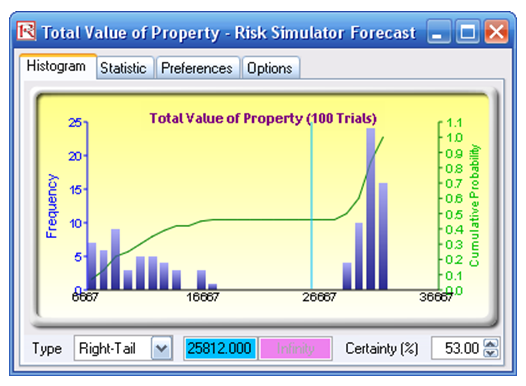
Figure 102.4: Total property value forecast chart
To replicate the model and create it from scratch, follow the instructions:
- Go to the Model worksheet and click on Risk Simulator | New Profile and give the profile a name.
- Set the objective. Select cell H10 (Total Value of Property) and click on the O icon or Risk Simulator | Optimization | Set Objective (Figure 102.5).
- Set the decision variable. Select cell D7 (Annual Harvest) and click on the D icon or Risk Simulator | Optimization | Set Decision. Select Continuous and click on the link icon and link the lower bounds and upper bounds to D12 and D13 (Figure 102.6). Continuous decision variables can be chosen as the number of trees modeled is in thousands of units.
- Reset the decision variable. Change the value in cell D7 to some starting value, for example, 100.
- Prepare to run the optimization. Click on the Run Optimization icon or Risk Simulator | Optimization | Run Optimization (Figure 102.7).
- Run the optimization. Click on the Method tab and select Static Optimization and click OK. Click Replace when the optimization routine is complete. You will see the optimal annual harvest is 125.80, providing the highest total value of the property.
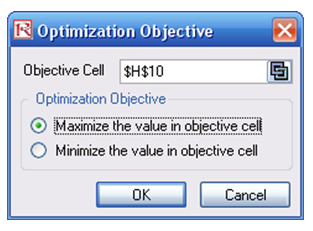
Figure 102.5: Setting optimization objective
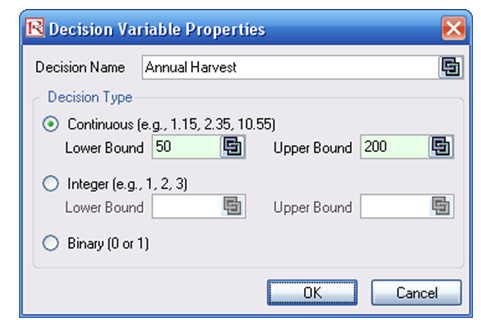
Figure 102.6: Continuous decision variables

Figure 102.7: Optimization run