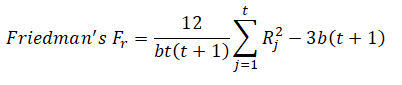
The Friedman test is the extension of the Wilcoxon Signed-Rank test for paired samples. The corresponding parametric test is the Randomized Block Multiple Treatment ANOVA, but unlike the ANOVA, the Friedman test does not require that the dataset be randomly sampled from normally distributed populations with equal variances. The Friedman test uses a two-tailed hypothesis test where the null hypothesis is such that the population medians of each treatment are statistically identical to the rest of the group; that is, there is no effect among the different treatment groups. Similar to the ANOVA method, Friedman tests the following hypotheses:
Similar to the ANOVA with Blocking Variable, the data needs to be set up in a B × T fashion, where the blocking variables (B) are listed in rows and the treatments (T) are in columns as different variables. Figure 9.37 illustrates an example with the correct data setup. As an example, assume that a company is testing a new stain remover liquid, and the company has come up with four distinct formulations. These formulations are listed as the treatments, T, as different variables (columns). For each formulation or treatment, the stain remover was applied to various stain types (the blocking variable, B). In the example, there were six types of stains tested (e.g., chocolate, red wine, coffee, ink, paint, crayon) and these are listed in the rows. Each row represents one specific type of stain (e.g., row 1 may represent red wine). The numerical data in the grid is a value between 1 and 10, with a high number indicating that the stain was completely removed. The computed Fr statistic is 8.45, which is statistically significant at the 5% alpha level, so we can reject the null hypothesis and conclude that at least one of the formulations is different than the rest.
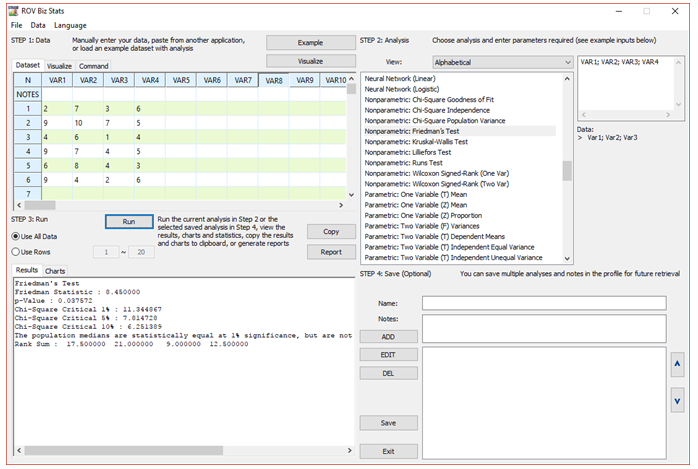

Figure 9.37: Friedman’s Test