Before embarking on solving an optimization problem, it is vital to understand the terminology of optimization––the terms used to describe certain attributes of the optimization process. These words include: decision variables, constraints, and objectives.
Decision variables are quantities over which you have control; for example, the amount of a product to make, the number of dollars to allocate among different investments, or which projects to select from among a limited set. As an example, portfolio optimization analysis includes a go or no-go decision on particular projects. In addition, the dollar or percentage budget allocation across multiple projects also can be structured as decision variables.
Constraints describe relationships among decision variables that restrict the values of the decision variables. For example, a constraint might ensure that the total amount of money allocated among various investments cannot exceed a specified amount or, at most, one project from a certain group can be selected, budget constraints, timing restrictions, minimum returns, or risk tolerance levels.
Objectives give a mathematical representation of the model’s desired outcome, such as maximizing profit or minimizing cost, in terms of the decision variables. In financial analysis, for example, the objective may be to maximize returns while minimizing risks (maximizing the Sharpe’s ratio or returns-to-risk ratio).
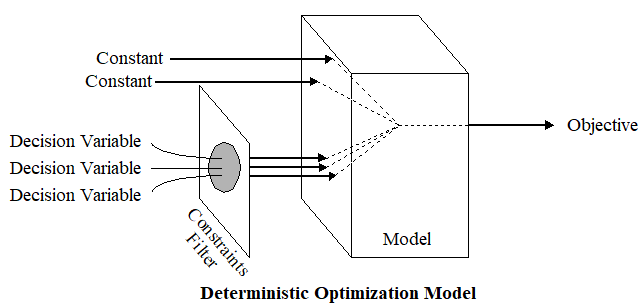
Conceptually, an optimization model might look like Figure 16.4.

Figure 16.4: Visualizing Optimization I
The solution to an optimization model provides a set of values for the decision variables that optimizes (maximizes or minimizes) the associated objective. If the real business conditions were simple and if the future were predictable, all data in an optimization model would be constant, making the model deterministic.
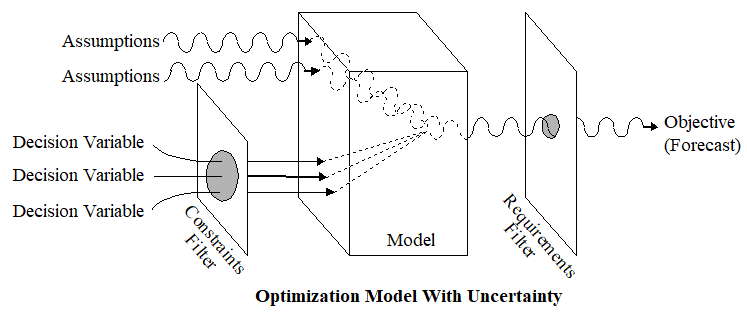
In many cases, however, a deterministic optimization model cannot capture all the relevant intricacies of a practical decision-making environment. When a model’s data are uncertain and can only be described probabilistically, the objective will have some probability distribution for any chosen set of decision variables. You can find this probability distribution by simulating the model using Risk Simulator. An optimization model under uncertainty has several additional elements, including assumptions and forecasts.
Assumptions capture the uncertainty of model data using probability distributions, whereas forecasts are the frequency distributions of possible results for the model. Forecast statistics are summary values of a forecast distribution, such as the mean, standard deviation, and variance. The optimization process (Figure 16.5) controls the optimization by maximizing or minimizing the objective.

Figure 16.5: Visualizing Optimization II
Each optimization model has one objective, a variable that mathematically represents the model’s objective in terms of the assumption and decision variables. Optimization’s job is to find the optimal (minimum or maximum) value of the objective by selecting and improving different values for the decision variables. When model data are uncertain and can only be described using probability distributions, the objective itself will have some probability distribution for any set of decision variables.


