File Name: Forecasting – Multiple Regression
Location: Modeling Toolkit | Forecasting | Multiple Regression
Brief Description: Illustrates how to run a multiple or multivariate regression analysis
Requirements: Modeling Toolkit, Risk Simulator
This example shows how multiple regression can be run using Risk Simulator. The raw data are arranged in the Cross-Sectional Data worksheet, which contains cross-sectional data on all 50 U.S. states on the number of aggravated assaults (in thousands) per year, the number of bachelor’s degrees awarded per year, police expenditure per capita population, population size in millions, population density (person per square mile), and unemployment rate. The idea is to use multiple regression analysis to see if there is a relationship between the number of aggravated assaults per year and these explanatory variables.
Multiple Regression Analysis
To run this model, simply:
- In the Cross Sectional Data worksheet, select the area C5:H55.
- Select Risk Simulator | Forecasting | Multiple Regression.
- Choose Aggravated Assault as the dependent variable in the regression and click on OK (Figure 87.1).
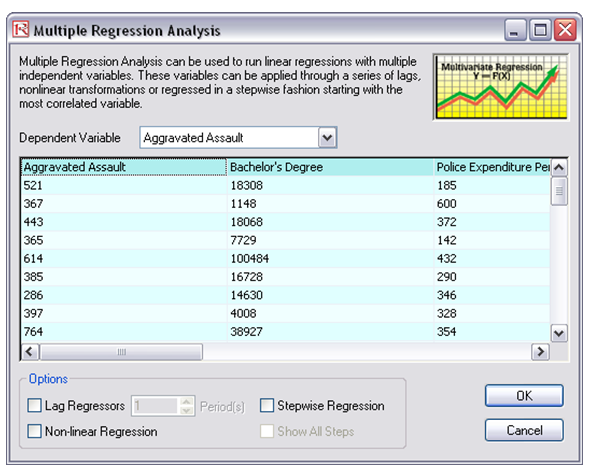
Figure 87.1: Running a regression
Note that more advanced regressions such as lag regressors, stepwise regression, and nonlinear regressions can also be run using Risk Simulator. For details on running such regressions as well as the results interpretation, refer to Modeling Risk, Third Edition (Thomson–Shore 2015) by Dr. Johnathan Mun.
Results Summary
Refer to the Report worksheet for details on the regression output. The worksheet has more details on the interpretation of specific statistical results. It provides these elements: multiple regression and analysis of variance output, including coefficients of determination; hypothesis test results (single variable t-test and multiple variable F-test); computed coefficients for each regressor; fitted chart; and much more. Also, remember to look at the Forecasting – Data Diagnostics models chapter for running analytical and econometric diagnostics such as multicollinearity, autocorrelation, micronumerosity, distributive lags, and other technical regression issues before running a regression analysis.
The dataset was set up intentionally in such a way that some of the independent variables are significant while others are not statistically significant (you can tell this from the t-test computed p-values in the report), and some of the variables are nonlinearly related to the dependent variable. Therefore, try out several variations of your model to find the best fit. Finally, do not forget to put the dataset through the data diagnostics tool in Risk Simulator. See the Forecasting – Data Diagnostics chapter for how to do this.