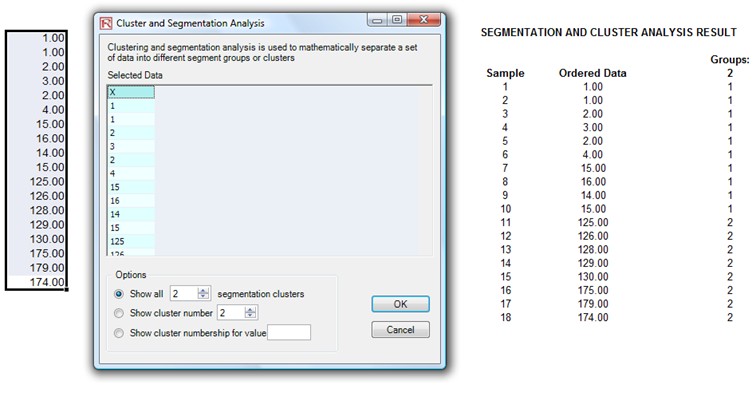
A final analytical technique of interest is that of segmentation clustering. Figure 15.26 illustrates a sample dataset. You can select the data and run the tool through Risk Simulator | Analytical Tools | Segmentation Clustering. Figure 15.26 shows a sample segmentation of two groups. That is, taking the original dataset, we run some internal algorithms (a combination or k-means hierarchical clustering and other methods of moments in order to find the best-fitting groups or natural statistical clusters) to statistically divide or segment the original dataset into two groups. You can see the two-group memberships in Figure 15.26. Clearly, you can segment this dataset into as many groups as you wish. This technique is valuable in a variety of settings including marketing (market segmentation of customers into various customer relationship management groups etc.), physical sciences, engineering, and others.
The results from cluster analysis create clusters of multiple groups, partitioned based on data similarity for exploratory data analysis and data mining (e.g., machine learning, pattern recognition, image analysis, bioinformatics, etc.). The objects in the same cluster are more similar to each other than those in other clusters. In addition, cluster analysis can be used to discover data structures without providing an explanation or interpretation of the relationship among variables.

Figure 15.26: Segmentation Clustering Tool and Results

