Linear Discriminant Analysis is related to ANOVA and multivariate regression analysis, which attempt to model one dependent variable as a linear combination of other independent variables. Discriminant analysis typically has multiple continuous independent variables and a single categorical dependent variable. The Quadratic Discriminant Analysis is the nonlinear counterpart, where we assume there are nonlinear combinations of the independent variables that best explain the dependent variable.
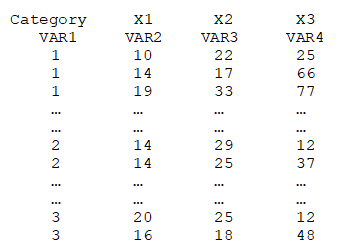
As an illustration, the following shows part of a dataset used in BizStats, where the dependent variable is the categorical variable. For example, each row may constitute an individual, where the Category may be something like Agree, Neutral, and Agree, while the independent predictor variables X1 to X3 may be years of education, knowledge of the product, experience using the product, and so forth.
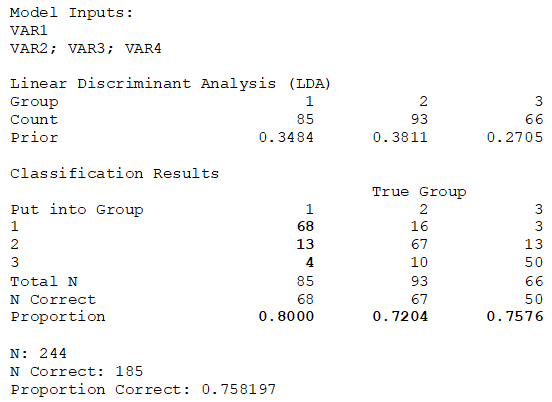
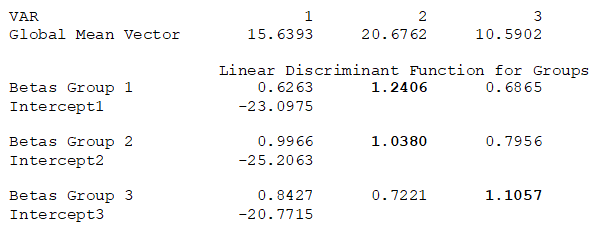
In the results, the “True Group” versus “Put into Group” matrix illustrates that, statistically, 68 individuals who should be categorized as Group 1 are indeed put into this group in the raw data, with 13 and 4 others incorrectly put into groups 2 and 3, respectively. This indicates an 80% accuracy. For groups 2 and 3, the grouping accuracy is 72% and 76%, respectively. The linear discriminant function shows that variable X2 (1.2406 and 1.0380 are the highest factors) has the highest impact on whether an individual is in Group 1 and 2, while variable X3 (1.1057 is the highest factor) has the highest impact on whether individuals should be in Group 3. Using this method, certain types of data can be tested to see how the statistically predicted groupings match up against the actual group membership, as an additional layer of data validity checking.