In the previous single ANOVA test, the assumption was that the treatments were completely and randomly assigned to all the persons in the experiment. This approach may result in overrepresentation and underrepresentation in some treatment groups simply by chance. If the properties or characteristics of the individuals participating in the experiment have a strong influence on the measurements and data obtained, the single ANOVA may end up measuring the differentials inside this experimental group instead of the effects of the treatments. To resolve this issue, ANOVA with Randomized Block can be used. Note that the nonparametric equivalent is the Friedman’s test.

Example: Suppose that there are four auto headlamps under development. The manufacturer wishes to test the visibility of each lamp design by measuring how far someone can see using each of these headlamps. Now suppose 12 individuals were randomly selected to participate in this experiment, and suppose we categorize these participants as young (Y), middle-aged (M), and old (O). If we completely randomize the selection of these individuals, each of the methods may be over- or underrepresented in terms of age groups, as seen in the first data grid in Figure 9.17. Now, further suppose that the participants’ properties (e.g., age) have an influence on their vision (e.g., older participants cannot see as far as someone much younger). Consequently, completely randomizing the participants into these groups will yield biased results. The better approach is to block this intervening age variable. Figure 9.17’s second data grid shows how to set up an ANOVA dataset with blocks. In this example, there are three blocks, and they are stratified into rows.
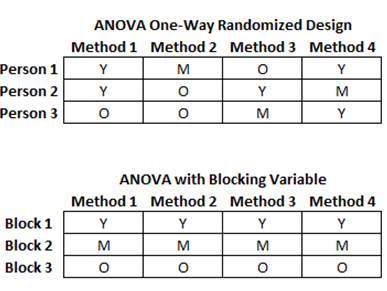
Figure 9.17: Setting Up an ANOVA with Randomized Blocks
The calculations for the Randomized Block ANOVA are shown below:
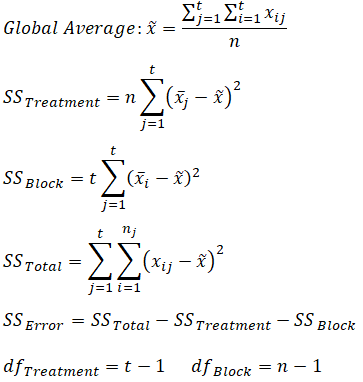
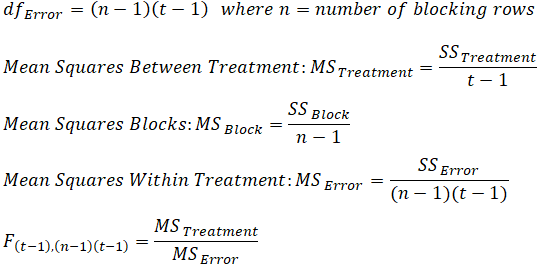
Figure 9.18 illustrates a step-by-step approach to calculating this ANOVA model.
Figure 9.19 shows the results of the ANOVA with randomized blocks using ROV BizStats. The figure shows how the calculations can be implemented and the corresponding settings. The p-value for the treatment is 0.0129 and the p-value for the blocking variable (age, in this case) is 0.0001. This indicates that there is a statistically significant difference in at least one of the treatments and that the blocking variable (age) does have a statistically significant effect on the dataset.
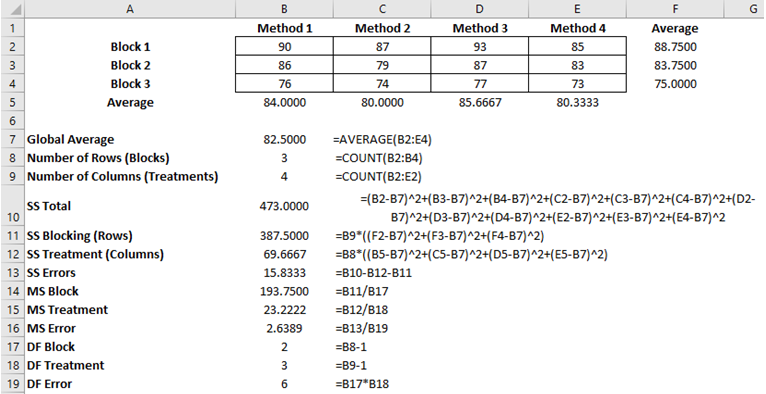

Figure 9.18: Computing an ANOVA with Randomized Blocks
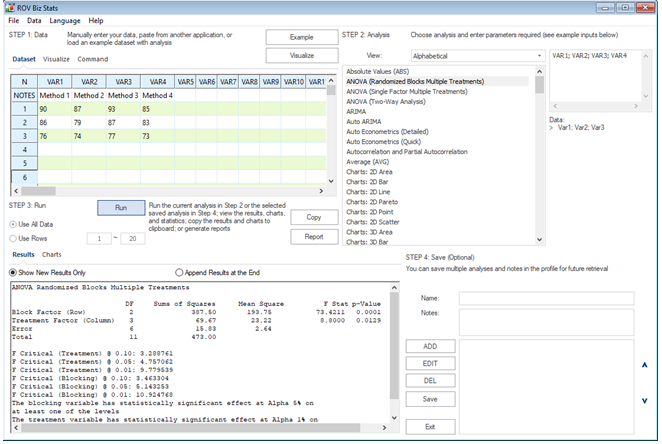

Figure 9.19: ANOVA with Randomized Blocks Results Using ROV BizStats

