File Names: Real Options Strategic Cases – High-Tech Manufacturing’s Strategy A; Real Options Strategic Cases – High-Tech Manufacturing’s Strategy B; Real Options Strategic Cases – High-Tech Manufacturing’s Strategy C
Location: Modeling Toolkit | Real Options Models
Brief Description: Frames and solves a real options problem of choosing between build and buy strategies when the underlying project is filled with risk and uncertainty
Requirements: Modeling Toolkit, Real Options SLS
Microtech, Inc. is a billion-dollar high-tech manufacturing firm interested in developing a new state-of-the-art, high-capacity micro hard drive that fits into the palm of your hand. The problem is, the larger the capacity, the larger the magnetic disk has to be, and the faster it has to spin. Therefore, making small hard drives is difficult enough, let alone a high-capacity hard drive that is reliable and state-of-the-art. The risks the firm faces include market risks—will this product sell, will it sell enough, and at what price?—and private risks—will the technology work and can we develop it fast enough ahead of the competition?—both of which are significant enough to yield disasters in the project. In performing its due diligence, the vice president of the firm’s advanced emerging technologies found a small start-up that is currently developing such a technology, and it is approximately three-quarters of the way there. This start-up will initiate a patent process in the next few weeks. Microtech would like to consider acquiring the start-up prior to the initiation of the patent process. The start-up has shown interest in being acquired and based on preliminary discussions, requested $50M for the firm.
The question is, should Microtech acquire the firm and mitigate some development risk but still face the market risk and some residual development risk? After all, the start-up has the technology only partially completed. Then again, through the acquisition, Microtech can take a potential rival out of the picture and even mitigate the chances of its competitors acquiring this firm’s technologies. How much is this firm really worth, compared to its asking price of $50M? What options exist to mitigate some of the market and development risks? Can Microtech take advantage of additional opportunities in the market through the acquisition?
The finance staff at Microtech with the assistance of several external consultants began to collect all the relevant data and created a DCF model. The best-guess present value of the benefits from the firm is $100M. This means that the NPV of buying the firm is $50M after accounting for the acquisition cost of $50M. In the DCF model, the probability of technical success is also modeled (using several binomial distributions and their relevant probabilities of success in several phases multiplied together) as well as the market positioning (triangular distributions were used to simulate the different market conditions in the future). Using Risk Simulator software, the Monte Carlo simulation’s resulting annualized volatility is found to be 25%, a somewhat moderate level of risk. The finance staff also created another DCF with which to compare the result. This second DCF models the scenario of building the technology in-house. The total development cost in present value will be $40M, a lot less than the acquisition cost of $50M. At first glance, Microtech might be better off building the technology in-house, providing an NPV of $60M. However, the volatility is found to be 30% as it is riskier to develop the technology from scratch than to buy a firm with the technology almost completed.
The question now becomes: What, if any, strategic real options exist for Microtech to consider? Is the NPV analysis sufficient to justify doing it itself? What about all the market and private risks in the project? If acquiring the firm, are there any options to protect Microtech from failure? If building the technology itself, are there any options to mitigate the development risks?
Microtech then proceeded to perform some real options framing exercises with its executives, facilitated by an external real options expert consultant. The questions raised included what risks exist and how can they be reduced. The real options consultant then put a real options framework around the discussions and came up with a preliminary strategy tree (Figure 194.1). For the first pass, four main options were conceived: mitigate the development risk of building themselves; mitigate the risk of the market; mitigate the risk of failure if acquiring the firm; and take advantage of the upside risks whenever possible. These options are compiled into path-dependent strategies in Figure 194.1.
Strategy A is to develop the technology in-house with the R&D risk mitigated through a stage-gate investment process, where the total $40M required investment is spread into four steps of $10M each (in present values). At any phase of the development, the fate of the next stage is determined (i.e., to decide if the R&D initiative should continue depending on the outcome of the current phase). The investment can be terminated at any time, and the maximum loss will be the total investment up to that point. That is, if R&D shows bad results after one year, the initiative is abandoned, the firm exits the project, and the maximum loss is $10M, not the entire $40M as defined in the DCF model. The questions are: How much is this strategic path worth? Is stage-gating the process worth it?
Strategy B is to develop the technology but hedge the market risk. That is, a preliminary Phase I market research is performed for $5M in the first year to obtain competitive intelligence on Microtech’s competitors and to see if the market and complementary technologies exist such that the microdrive will indeed be successful. Then, depending on the results of this market research, Phase II’s R&D initiative will or will not be executed. Because the market research takes an entire year to complete, further stage-gating the R&D initiative is not an option because it will significantly delay product launch. So Phase II is a full-scale R&D. In this strategic path, although the market risk is mitigated through market research, the development risk still exists. Hence, a contraction option is conceived. That is, Microtech finds another counterparty to assume the manufacturing risks by signing a two-year contract whereby at any time within the next two years, Microtech can have this counterparty firm take over the development of the increased rotational latency and seek times of the microdrives during the R&D process. The counterparty shares in 30% of the net profits without undertaking any R&D costs. Microtech will assume the entire $40M R&D cost but ends up mitigating its highest development risks and also saves $10M (in present values) by not having to increase its own manufacturing competencies by hiring outside consultants and purchasing new equipment. The questions are: How much is this strategic path worth? Is the market research valuable? How much should Microtech share its net profits with the counterparty?
Strategy C is to purchase the start-up firm for $50M. However, by acquiring the firm, Microtech obtains additional options. Specifically, if the technology or market does not work out as expected, Microtech can sell the start-up (sell its intellectual property, patents, technology, assets, buildings, etc.) for an estimated salvage value of $25M within the first year. As the content of the start-up’s intellectual property is expected to increase over time because of added development efforts, the salvage value is expected to increase by $1M each year. If the technology is successful within the next five years, other products can be created from this microdrive base platform technology. For instance, the microdrive is applicable for use not only in laptops; with an additional funding of $5M, the technology can be adapted into handheld global positioning system (GPS) map locators for cars and travel enthusiasts, personal pocket-size hard drives (where people can carry an entire computer on a key chain; all they have to do is plug it into a monitor and the virtual computer comes up), MP3 players, and a multitude of other products, which by Microtech’s estimates, will increase the NPV of the microdrive by 35%. However, this expansion option exists only in Strategy C, as time to market is crucial for these new products and the start-up already has three-quarters of the technology completed, speeding Microtech’s time to market tremendously. The questions are: How much is the start-up actually worth to Microtech? Is $50M too high a price to pay for the company? Figure 194.1 shows these three strategic paths and relevant information on each strategy branch.
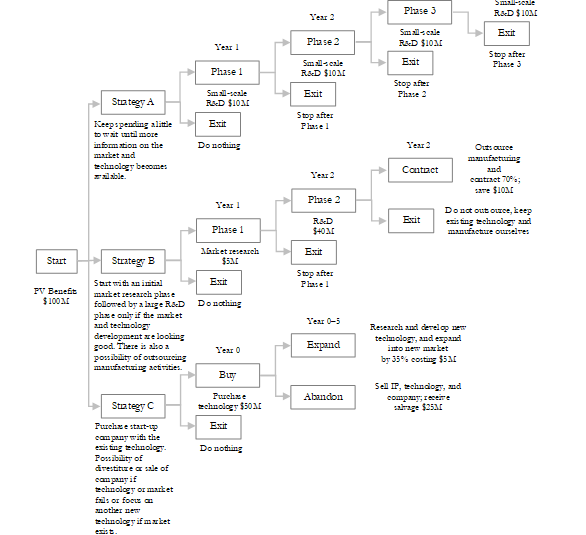
Figure 194.1: Strategy tree on build versus buy
Real Options Strategic Cases – High-Tech Manufacturing’s Strategy A
Strategy A’s total strategic value is worth $64.65M using the Multiple Asset SLS software with 100-step lattices as seen in Figure 194.2. The NPV is $60M, indicating that the option value is worth $4.65M. This means that there is definitely value in stage-gating the R&D initiative to hedge downside risks. To follow along, open the SLS file: Strategic Cases – High-Tech Manufacturing’s Strategy A.
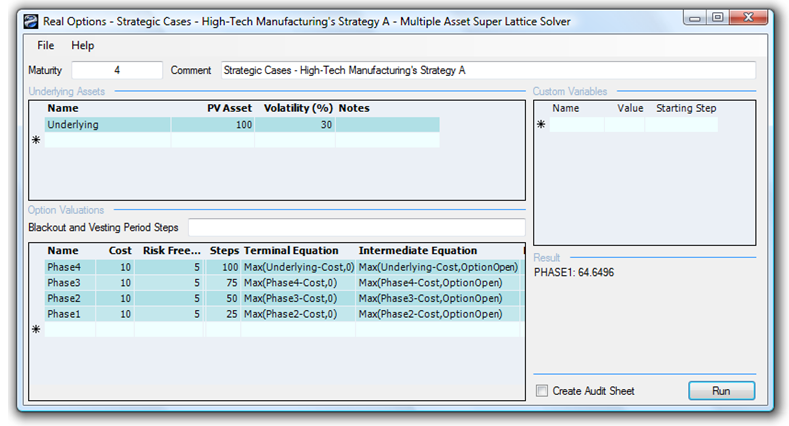
Figure 194.2 Value of Strategy A
When the annualized dividend rate exceeds 2.5%, the option value becomes zero and the total strategic value reverts to the NPV of $60M, as seen in Figure 194.3. This means that by spending more time and putting off development through a stage-gate process, as long as the maximum losses per year (lost market share and opportunity losses of net revenues from sales) do not exceed $2.5M (2.5% of $100M), then stage-gating is valuable. Otherwise, the financial leakage is too severe; the added risk is worth it and the $40M should be spent immediately on a large-scale development effort. Progressively modify each valuation phase’s dividend rate from 0% to 2.5%.
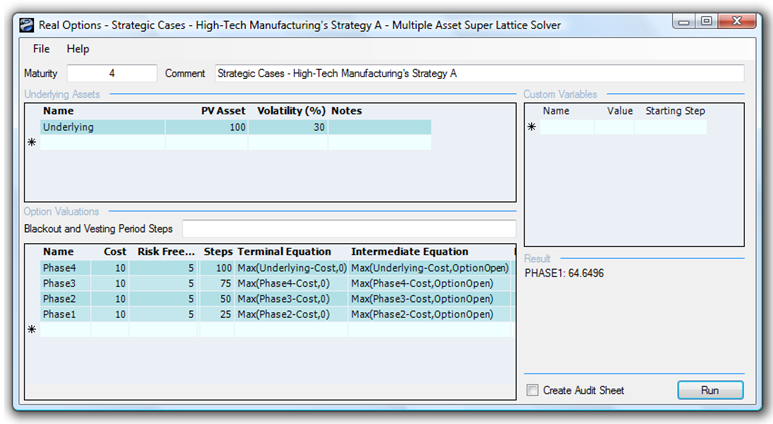
Figure 194.3: Strategy A’s break-even point
Real Options Strategic Cases – High-Tech Manufacturing’s Strategy B
The total strategic value of Strategy B is valued at $75.90 (rounded) as seen in Figure 194.4. The NPV is $55M (computed by taking $100M – $5M – $40M), which means that the options are valued at $20.90M. So, thus far, Strategy B is the better strategic path, with a value of $75.90M. In addition, Figure 194.5 shows the strategic value without the contraction option, worth $59.06M ($4.06M option value to stage-gate with market research and $55M NPV). Thus, the contraction option with the counterparty to hedge the downside technical risk is worth $16.84M. A further analysis can be performed by changing the contraction factor (how much is allocated to the counterparty) and the amount of savings, as seen in Figure 194.6.
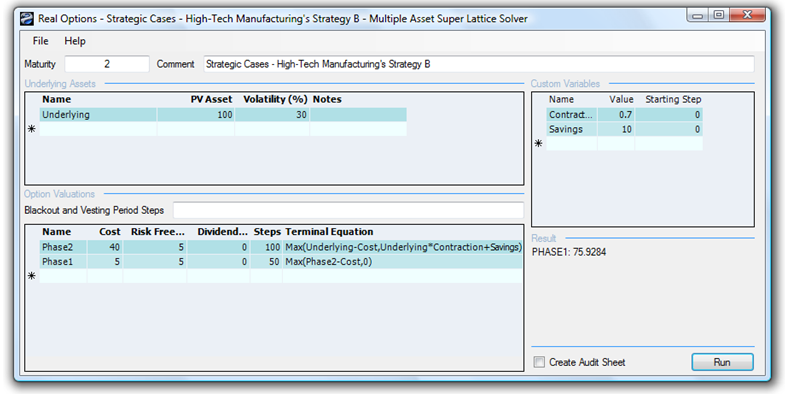
Figure 194.4: Value of Strategy B
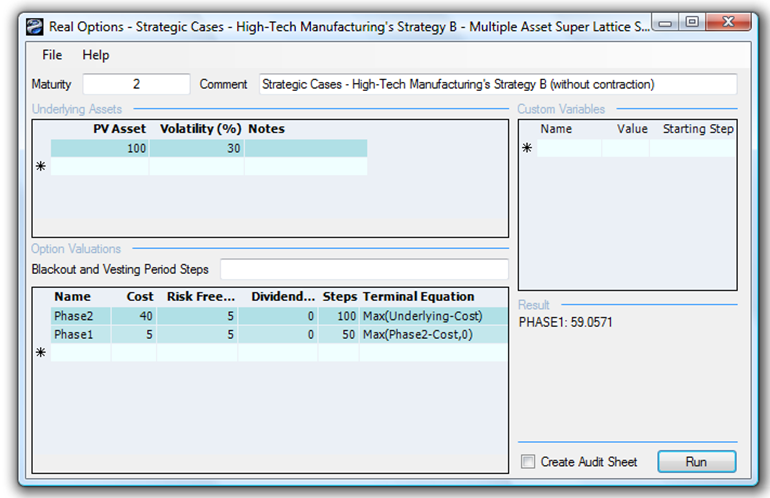
Figure 194.5: Strategy B without contraction
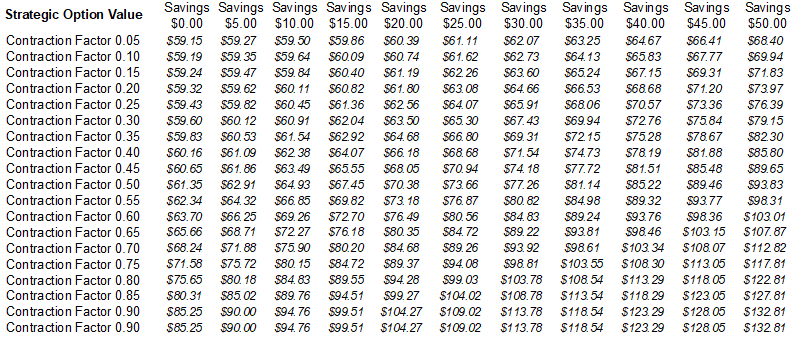
Figure 194.6: Decision table on savings and contraction factors
Real Options Strategic Cases – High-Tech Manufacturing’s Strategy C
Finally, the total strategic value for Strategy C (Figure 194.7) is valued at $131.12 less the $50 purchase price of the start-up company or a net strategic value of $81.12M. That is, Microtech should be willing to pay no more than $55.22M for the start-up (i.e., $50M + $81.12M – $75.90M), otherwise, it is better off pursuing Strategy B and building the technology itself.
Thus, the optimal strategy is to purchase the start-up company, go to market quickly with the ability to abandon and sell the start-up should things fail, or to further invest an additional R&D sum later on to develop spin-off technologies. If real options analysis were not performed, Microtech would have chosen to develop the technology itself immediately and spend $40M. This strategy would yield the highest NPV if real options and risk mitigation options are not considered. Microtech would have made a serious decision blunder and taken unnecessary risks. By performing the real options analysis, additional spin-off products, and opportunities surface, which prove to be highly valuable.
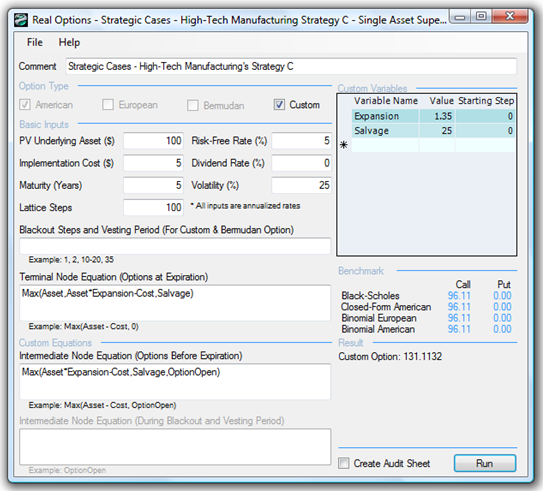
Figure 194.7: Value of Strategy C