File Name: Analytics – Ships in the Night
Location: Modeling Toolkit | Analytics | Ships in the Night
Brief Description: Simulates arrival and meeting times and calculates the probability that two individuals will meet given a meeting time window
Requirements: Modeling Toolkit, Risk Simulator
This chapter models the arrival of two people at a prespecified location at a prespecified time and figures out the probability of whether they will meet. For instance, we can simulate the probability that two people will meet if they have a prespecified time window to meet (e.g., if the time to meet is between 1:30 PM and 2:00 PM, then the time window to meet is 30 minutes) and time to wait (e.g., when each person arrives, the person will wait up to, say, 5 minutes before leaving).
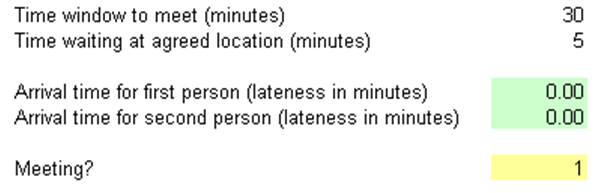
Figure 7.1: Meeting time model
The arrival times of both people are simulated assumptions using a uniform distribution between 0 and the time window to meet (i.e., if the time window is between 1:30 PM and 2:00 PM, then the person can arrive exactly at 1:30 PM, defined as 0 minutes arrival time, 1:31 PM, defined as 1 minute arrive time, and so forth) as seen in Figure 7.1. Therefore, both people meet if the absolute value of the difference between these arrival times defined as “Absolute value of (Second Person’s Arrival Time minus the First Person’s Arrival Time)” is less than or equal to the Waiting Time, then they meet; otherwise, they do not meet. We simulate both arrival times without any correlations. You can add in correlations to account for any co-experiences upon arrival (e.g., traffic congestion is felt by both parties, and they can potentially arrive late together if they take the same route).
After running the simulation, the forecast chart is typically bimodal, one for zero (not meeting), and the other for one (meeting). The table and forecast chart (Figures 7.2 and 7.3) show the results of a 1,000-trial simulation run with a seed value. The left-tail probability less than or equal to 0.9990 is 68.50%. This means that 68.50% of the time, the two parties do not meet, while they meet 31.50% of the time. Figure 7.2 shows various combinations of outcomes to test the sensitivity of the results of whether or not the two meet.
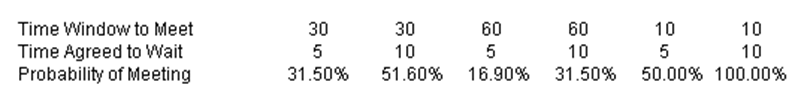
Figure 7.2: Summary results of probability of meeting
The sample results in Figure 7.2 make perfect sense. For instance, if they agree on a 30-minute window, the longer they agree to wait when they each arrive, the higher the probability of meeting up (i.e., 31.50% increases to 51.60% but notice that the probability is not doubled). In contrast, the wider the time to meet window (e.g., 60 minutes), the smaller the probability of meeting given the same agreed time to meet. One interesting fact is that as long as the proportion of waiting time to time window is the same, the probability of meeting is the same (e.g., 10 minutes waiting to 60-minute window is the same as 5 minutes waiting to a 30-minute window).
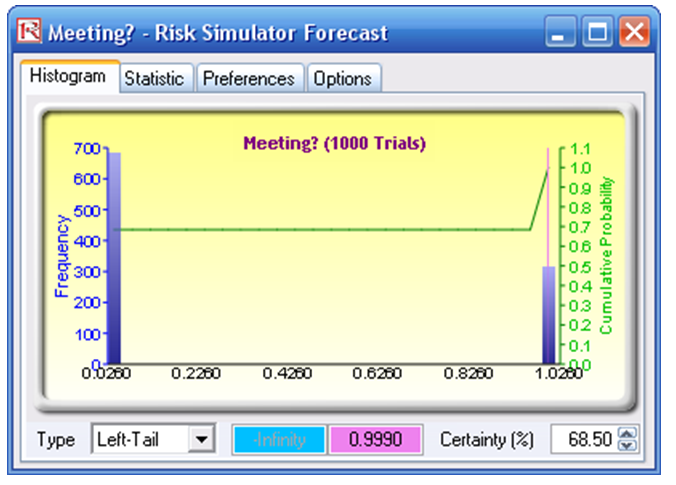
Figure 7.3: Forecast chart of meeting versus not meeting
Procedure
To run the predefined simulation, simply:
- Go to the Model worksheet and click on Risk Simulator | Change Profile and select the Ships in the Night profile.
- Click on the RUN icon or click on Risk Simulator | Run Simulation.
- Once the simulation has been completed, in the forecast chart, select Left-Tail or Right-Tail and enter in 999 in the Value box, and hit TAB on the keyboard to obtain the certainty value.
To recreate the simulation model, simply:
- Go to the Model worksheet and click on Risk Simulator | New Profile and give it a name.
- Go to cell G8 and set an assumption (click on Risk Simulator | Set Input Assumption and select Uniform Distribution and type in 0 for the minimum value). Click on the link icon beside the maximum input parameter and link it to cell G5 and click OK. Repeat for cell G9.
- Select cell G11 and make it a forecast (click on Risk Simulator | Set Output Forecast) and click OK.
- Click on the RUN icon or click on Risk Simulator | Run Simulation.
- Once the simulation has been completed, in the forecast chart, select Left-Tail or Right-Tail and enter in 999 in the Value box, and hit TAB on the keyboard, to obtain the certainty value.